Performance Marketing
Must-Know Marketing KPIs for Measuring Your Mobile App’s Performance
Nov 15, 2022

Performance Marketing

There are many key performance indicators (KPIs) to help marketers accurately measure an app’s performance — but not all marketing KPIs apply in every scenario, nor are they equally important.
Many app marketers spend a lot of their time on monetization through in-app purchases, advertising, subscriptions, and upgrades, but ignore deeper analysis — such as which users are worth retaining. To help you boost marketing efforts for your mobile game, we’ve compiled some must-know KPIs and strategies for tracking and optimizing your efforts across:
Getting your app noticed amid an ocean of competitors can be challenging; convincing users to install/register/grant permissions to your app is even harder.
That said, attributing installations to the correct omni-channel source and tracking associated revenue and payouts is critical, as is mastering discovery and acquisition metrics. Here’s what you need to look out for.
User acquisition is a common focus for marketers. While your strategy behind app store optimization (ASO) — including management of your app’s product page — is important, there are other key marketing KPIs to track:
Takeaway: It’s extremely important to measure attribution correctly. This will enable you to focus marketing emphasis on sources that perform well and reduce or eliminate focus on low-performing channels — and thereby decrease overall Cost Per Acquisition, or CPA (see below).
Tracking total downloads is important, but downloads are really just the tip of the iceberg. Users must install your app to use it, so it’s important to track what percentage of users fail to complete installation — and why. For example, if your app requires registration, subscribing to regular updates, access to personal data, or device permissions to access, say, contacts or photos, then a user may decide to cancel installation.
Takeaway: Diligently track failures to complete at every point during installation, as well as how long it takes a user to complete an action — for example, two minutes to install, two hours to register, two days to subscribe, and so forth.
Measuring how much it costs to onboard a user for your app can be approached in a few ways:
Takeaway: You should measure all three KPIs — CPI, CPA, and CAC — to get a holistic view of their marketing campaigns. This will allow you to optimize campaigns and use resources efficiently.
Analyzing user behaviors and using data to create compelling in-app experiences gives you insight into what your users enjoy the most in your app.
Here are the most important user behaviors you should be tracking:
A session represents the combined interactions a player has with your app in a given period of time (e.g. completing a level, buying upgrades, a performance slowdown) and gives you insight into how engaged users are with your app overall.
Specific session KPIs you want to track include:
In-app technical hiccups have a big impact on user experience and engagement. Key items to track here are:
Takeaway: Don’t underestimate the impact technical issues can have on your users. A poor user experience will result in shorter sessions, diminished revenue, uninstalls, and poor app store reviews.
Getting users to install and routinely use your game at scale is just the start. Now you need to figure out a way to make money. Maximizing your game’s monetization potential means understanding and incentivizing user behaviors. Here are KPIs to track to maximize monetization.
These are standard KPIs for measuring frequency of engagement. The more active (daily, monthly) users your game has, the greater its total revenue potential. What’s being measured is the number of unique users who may actually be active in several daily or monthly sessions.
Divide DAU by MAU to get an indication of stickiness. The closer DAU is to MAU, the stickier your app is.
Takeaway: Track DAU, MAU, and stickiness to help maximize your game’s revenue potential. The longer players are engaged with your app, the more likely they are to spend (i.e. generate revenue) in it.


You can break LTV down into three categories of variables:
Example
If your average user generates $1.35 in revenue every month and you have a monthly churn rate of 60%, then your customers are no doubt evangelizing your game in the form of ratings and reviews. But absent an accurate calculation, let’s set the referral value to 0. Plug in the numbers, and your average customer has a predicted LTV of $2.25.

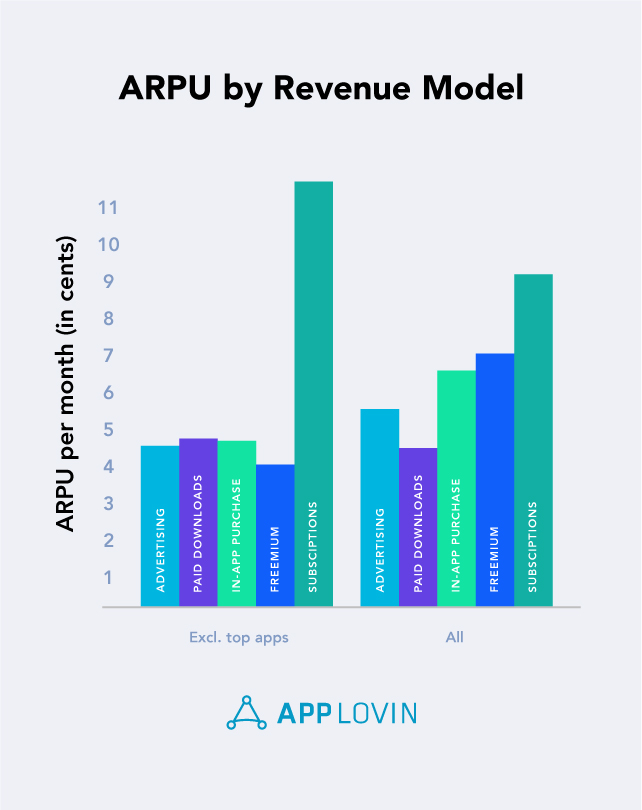
Takeaway: Measuring time to purchase, ARPU, and LTV will allow you to calculate the revenue potential for your game.
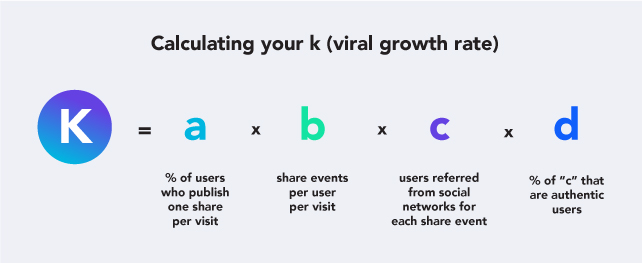
App marketers dream about going viral and like everything else, your app’s relative virality can be measured, tracked, and influenced. The standard tool for measuring virality is the K factor, which uses mentions, shares, and referrals multiplied by a specific channel’s conversion percentage to arrive at a rating of app virality.

Churn measures the rate at which users uninstall or unsubscribe from your app. In the same way that app marketers target specific potential users for acquisition during the discovery process, you should commit your energy and resources to retain and win back only those users who produce a profit.
The number of users who uninstall your app is certainly an important KPI for marketers to understand, but more importantly, you want to know why they leave. Was their ARPU and/or LTV even high enough to want them back?
There are many more metrics for measuring the performance of your gaming app at each phase of its market address. Some KPIs are quite simple, and others are very complex.
Instead of thinking of marketing KPIs as gospel, become a student of the data, focus on just the user behaviors that really matter, and pick the most critical KPIs for acquiring new users and monetizing your game.
Ready to start acquiring new users at scale? Check out AppDiscovery today.